Google Analytics is a well know tool and the most popular one used by website owners to see visitors’ data.
In 2020, Google released the newest version of Analytics called Google Analytics 4 with new abilities including data collection from websites and apps simultaneously.
As Universal Analytics will become a part of history in less than a year, it is recommended to switch to the new version ASAP.
But, before we dive deeper into the Google Analytics 4 tutorial, let’s briefly explore the newest features that Google has brought to us and the key differences between the two versions.
Switching From Universal Analytics to Google Analytics 4
As for Analytics 4, there are not many things that we can do to accommodate the changes that Google is pushing now, but at least we have a few months to go.
After all, Universal Analytics is still available, and you’re probably wondering when is the best time to switch to the newer version.
The answer is simple: the best time to perform this action is ASAP.
Why?
Because only one day of recorded data won’t give you enough information about your website visitors and their behavior. To better understand them and perform better analysis, you need historical data in order to act upon the decision-making process.
That means, as soon as you implement Google Analytics 4, more data will be available to you when Universal Analytics becomes history.
The Difference Between Universal Analytics and Google Analytics 4
If this is not your first time using Google Analytics, when you switch to the newer version, the first thing you will notice is that the dashboard is completely different.
First, lots of data reports and the concept itself are overhauled, and most of the old reports are simply cut out from the Analytics.
Comparing to Universal Analytics, where data was session-based, in GA4 everything is based on events.
For example, instead of just analyzing data, now you can easily analyze the funnel itself since the main dashboard is called the Life cycle.
The next thing is property creation. The views are unavailable, the data remains in one property, while filters are completely removed. The only traffic you are able to exclude is from your own company or company whose developers are working on your website.
However, the good news is that you are able to create custom reports in the Explore section where you are in full control of which dimensions and metrics will be displayed. Also, the Reports section is customizable, too. You can create different reports or apply changes to the current ones.
How to Install Google Analytics 4 on Your Website – Beginner guide
Unlike Universal Analytics, the implementation of Google Analytics 4 is a little bit different. As this platform works mostly on collecting data from different events, the flow of information goes through Google Tag Manager.
Google Tag Manager allows you to create custom tags for your Analytics property and track different events that you find most important for your business.
Also, this is a beginner-friendly tutorial to set up Analytics, unless your business requires more complex data acquisition like eCommerce data (purchases, refunds, cart behavior, etc.) which will not be covered this time.
There are two things you’ll need to configure GA4:
- Google Analytics account
- Google Tag Manager account
Both of them are available for free, you only need a Gmail account. Please note that emails from other providers won’t be able to create a Google Analytics account.
Well, enough talk, for now, let’s get busy.
Step 1: Create Google Analytics 4 Property
The first step is incredibly simple. First, you need a Gmail account, so make sure you have one (which we believe you already do) before proceeding with further steps.
Next, go to the Google Analytics main page and create your account.
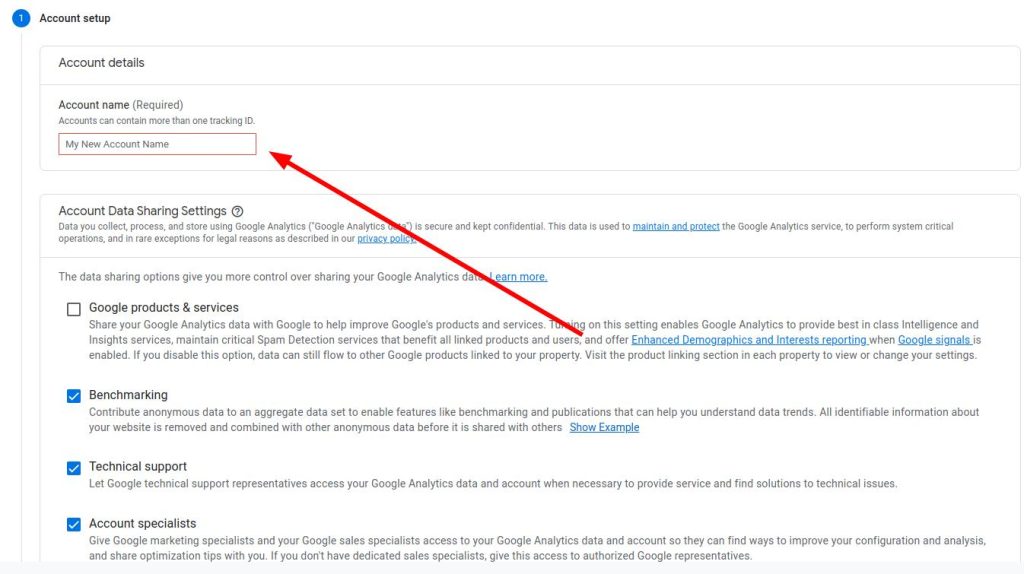
After you’ve created an Analytics account, you’ll have to create a property for your website inside that account. If you already have experience with Google Analytics, we will mention again, views inside the property are not available in the new version. All data is stored inside properties only.
In case you already have a Google Analytics account, the process is slightly different in the beginning, but after a few steps, everything is the same as before.
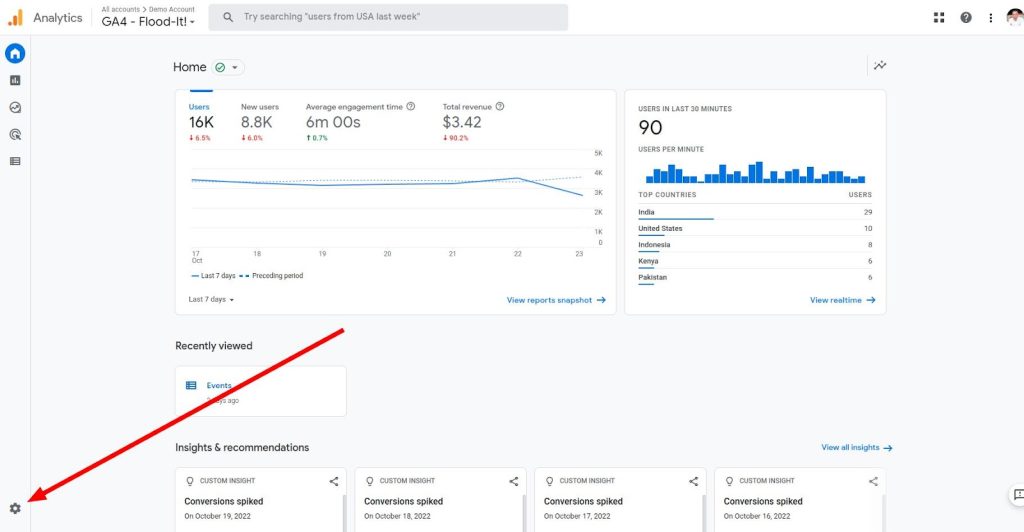
If that’s the case, when you open the official GA4 website, you will be redirected to the dashboard of the existing property. Take a look at the bottom left and you will notice a small gear wheel. That’s the Admin section. Click on it.
When redirected to the next dashboard, click on the blue button called Create Property (followed by the + sign on the left side).
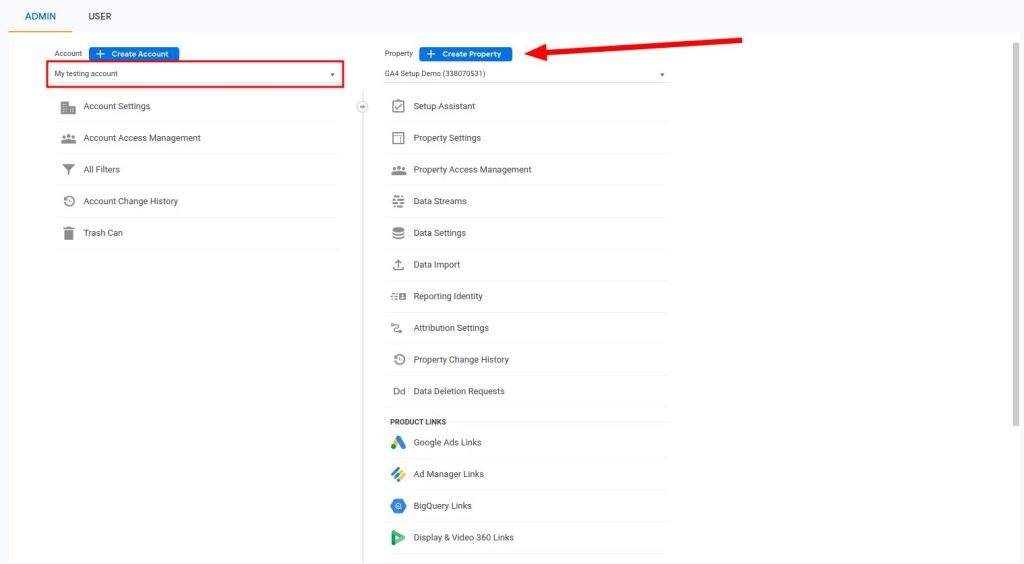
Pay attention that you are creating property inside the proper account (dropdown inside the red rectangle in the picture above).
The following steps are the same whether or not you had a Google Analytics account.
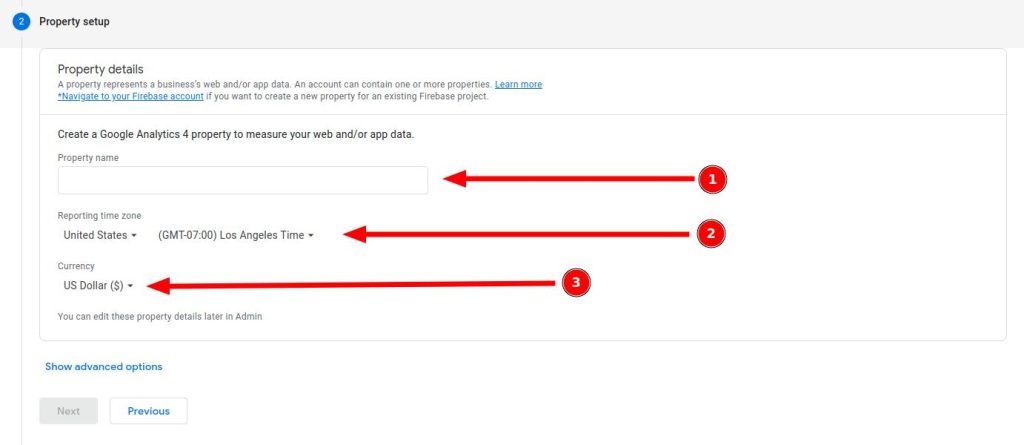
Go through the Property setup section and fill in the required fields. In the Property name field, you can enter the name of your business name, website name, etc. just make sure to name it properly to differentiate it in the future. It’s desirable this way if the need for multiple properties pops up (for example, you may create a second property for a staging environment of your website).
Next, make sure to select the appropriate Reporting time zone so Google can properly process and display data according to your business location (if you come from Europe, but choose the USA, the data may not be entirely correct because of different time zones). It’s enough to select the country, and Google will automatically set the time zone.
In case you have an eCommerce website and plan to track eCommerce data in the future, pick the currency for your business. Note: if you select USD for example, but your store is working with EUR, Google will automatically convert it with the current currency rates.
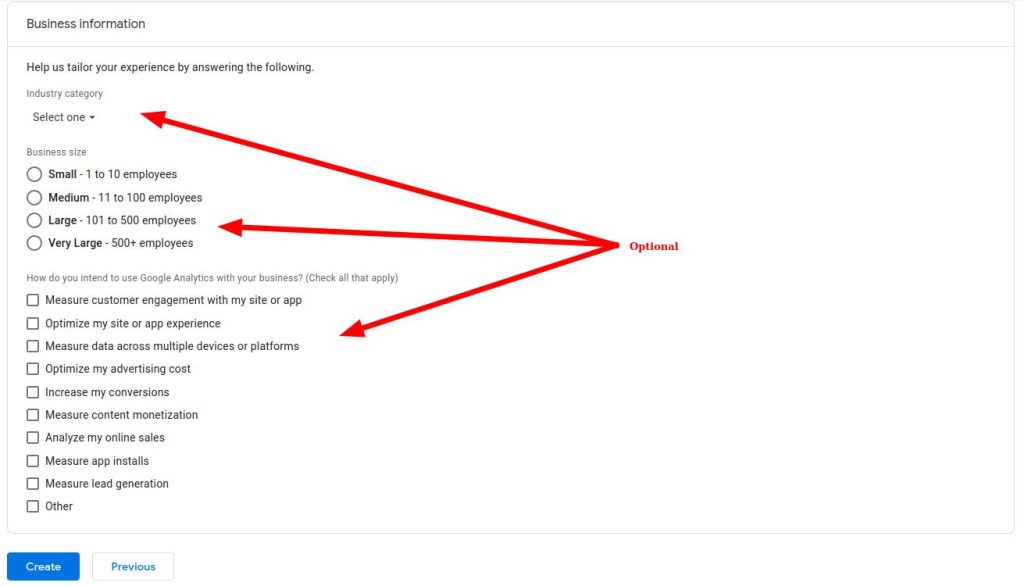
Next, you will be prompted to fill in the information about your business. Select the industry you are in, your business size, and, in the end, choose how you will use Google Analytics (you can select multiple boxes if you want).
Keep in mind that the part about describing your business is optional, so if you don’t want to populate this field or don’t have enough time to do it, just click the Create button, and your property will be created. However, the job is not done here, but we’re almost there.
It’s time to create your first data stream. In comparison to Universal Analytics, GA4 works through data streams. So, for example, you can add multiple websites as different data streams or sources (although, we believe you won’t need this). Besides that, you can connect your apps and collect all the data about your users’ behavior on all platforms.
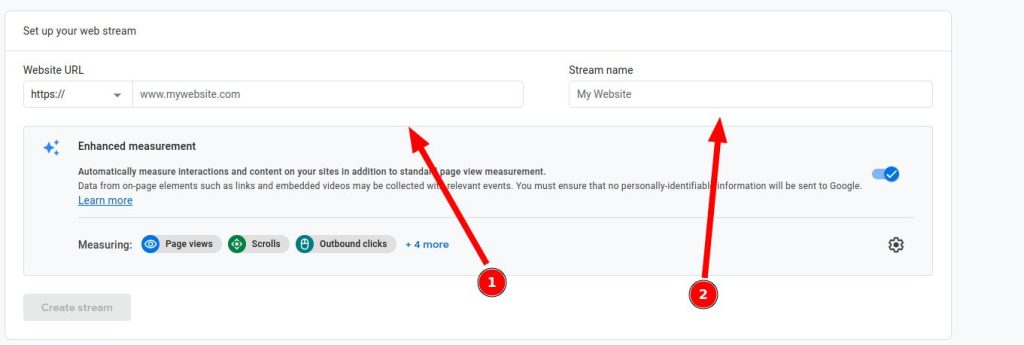
To set up the data stream, select Web, and when the next window opens fill in the website URL and stream name. Note: when adding a website domain, don’t include the protocol (http, https) as Google already has the dropdown selector for this. Also, if you use the www version of the website, make sure that it’s included in the URL when entering.

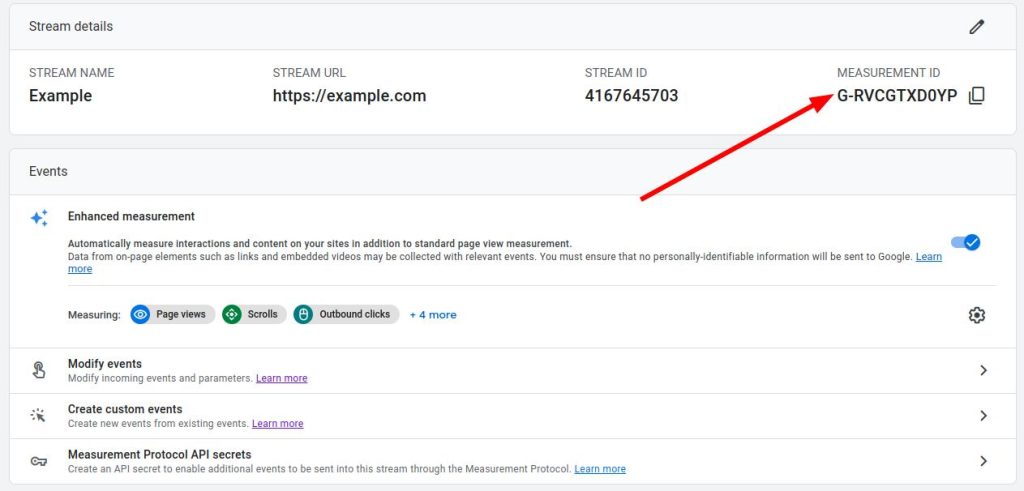
Now you can see your data stream in the dashboard. To proceed further with the implementation, you will need to get the Measurement ID located in the window after you click on the stream name (top right). This ID is later used in the Google Tag Manager configuration.
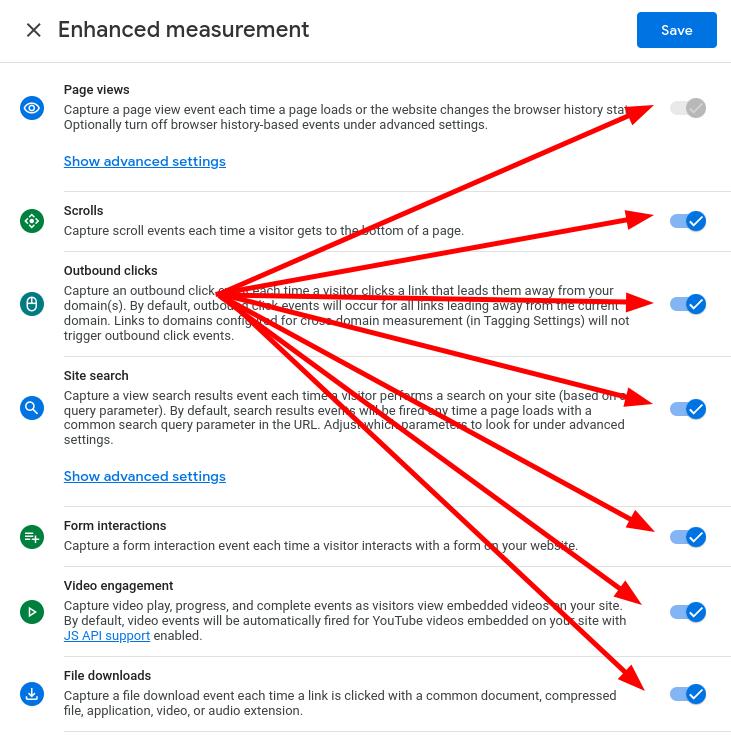
Now, your data stream will have some default options. Under the Events box, you can see which events will be measured by default.
They include:
- Page views,
- Scrolls,
- Outbound clicks,
- Site search,
- Video engagement,
- File downloads,
- Form interactions.
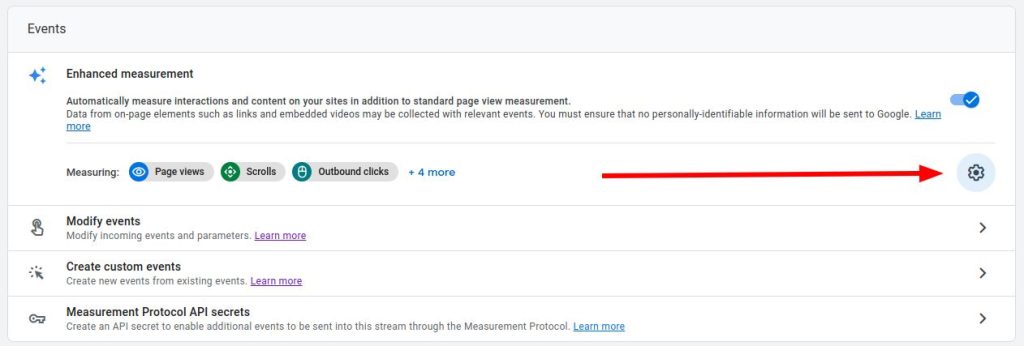
These are default events in Google Analytics 4, but by clicking on the small gear icon on the right side, you can enable or disable certain events of these if you want. The only exception if you decide on this is the page views event – it cannot be disabled. Of course, you can do this whenever you want, even if you already collected some data about those events, but keep in mind that they will remain in Google Analytics for some time.
Step 2: Create a Google Tag Manager Account
First, you will need a Google Tag Manager account to proceed. Go to the official website, click on the Start for free button, and then create a new account.
If you already have a Google Tag Manager account, the dashboard will look something like this:

Click on the blue Create Account button in the top right (like in the screenshot above). The rest is pretty much the same.

Enter your account name. It can be whatever you want. Then, select the country your business is located in. As for the Account setup, that’s it. The checkbox underneath is optional, you can leave it as it is.
Now, you have to add some data for the container you have to create (creating an empty account is not possible). In the Container name, enter the name of your business, website, etc. Despite the placeholder text showing the website URL, you don’t have to put the URL there. The name can be anything, but consider naming them properly in case you have multiple websites or projects that will require multiple containers or testing environments.
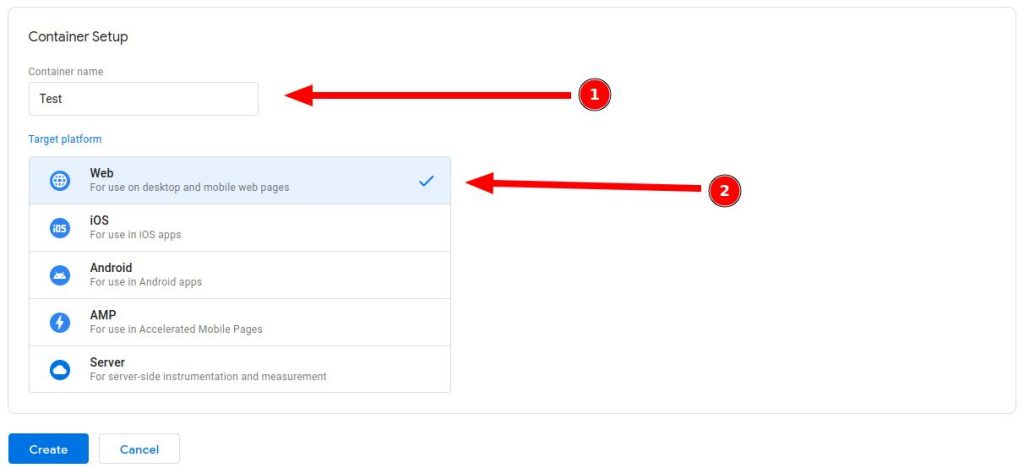
With that done, select the platform you want to track: Web, iOS, Android, AMP, or Server-side tagging (the last one requires lots of technical knowledge, so if you are working with GTM for the first time, the best thing you can do is avoid it).
Select Web as we currently want to collect data from the website.
When finished, the next window will pop up automatically. In the window, there are two codes provided by Google that have to be inserted inside the website. If you don’t have enough technical knowledge to enter these codes inside <head> and <body> tags of your website, consider using an extension or a plugin for that.
Insert those codes by following the guidelines Google already wrote or insert them into your extension/plugin. Don’t worry, these codes won’t break your website. The worst thing that could happen is your Analytics won’t collect the data, which is better than breaking your website entirely.
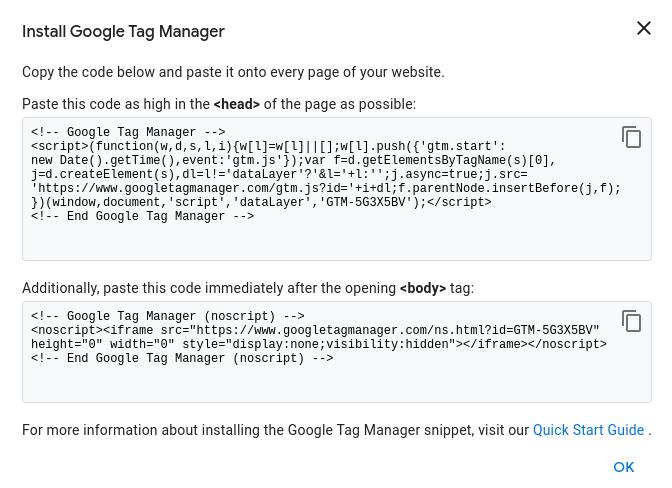
After you have finished the code installation, close the window and you will be redirected to the Workspace.
Now, let’s briefly explore the Google Tag Manager workspace dashboard.
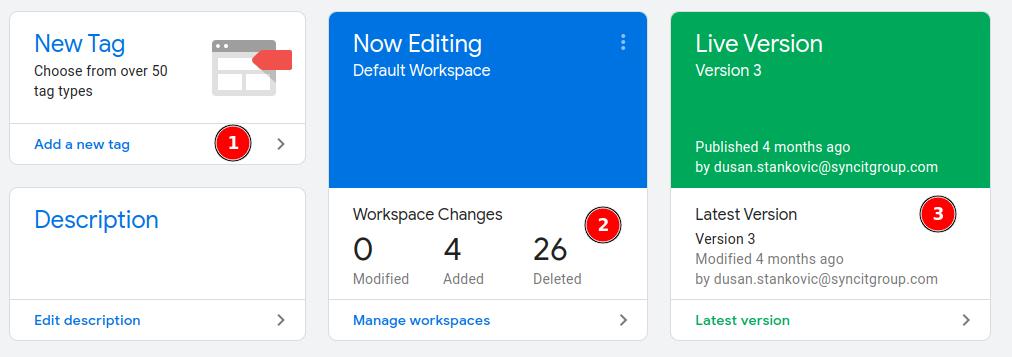
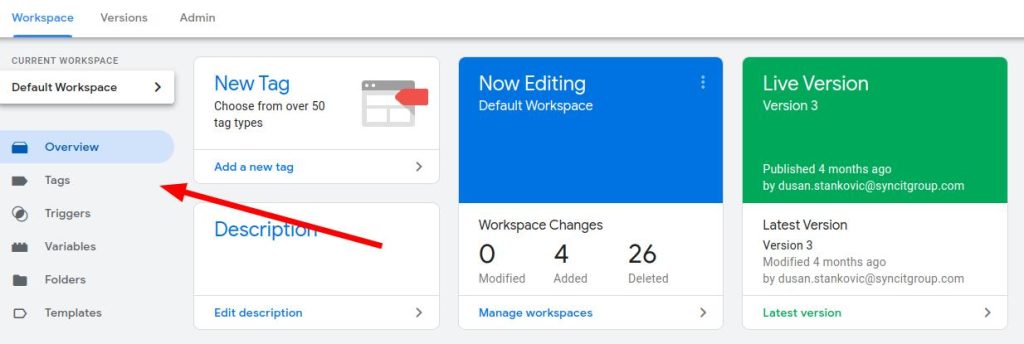
As you can see, there is a small box called New Tag that is actually a shortcut to adding a new tag as this can be done by clicking on Tags and then on Create a new tab.
On its right side, you can see two panels in blue and green boxes.
The blue box represents the changes that you have made to your workspace regarding tags, variables, and triggers. It doesn’t show which of these three you edited. Instead, it displays how many of them you have added, edited, or deleted. Also, when you publish the changes made to a container, these numbers reset to zero.
The green box shows the active version of a container. Each time you publish changes, you create a new version. This is made this way so that if you publish changes and somehow your container doesn’t work as it should, you can easily revert back to the previous version that worked well.
Now, let’s take a step away from that and explore the left menu consisting of the following sections:
- Overview – gives you a complete overview of the current Google Tag Manager setup;
- Tags – custom code segments and snippets;
- Triggers – tell the Google Tag Manager when to fire, where, and how;
- Variables – custom values that may be required for tags and triggers to work;
- Folders – allows you a grouping of tags, triggers, and variables per folder;
- Templates – premade templates for custom platforms such as Facebook pixel making the process of implementation easier.
Let’s see how to create a first tag for enabling the data collection on your website.
For this, you will need to create the configuration tag that’s already available. It requires minor tweaks to get it to work.
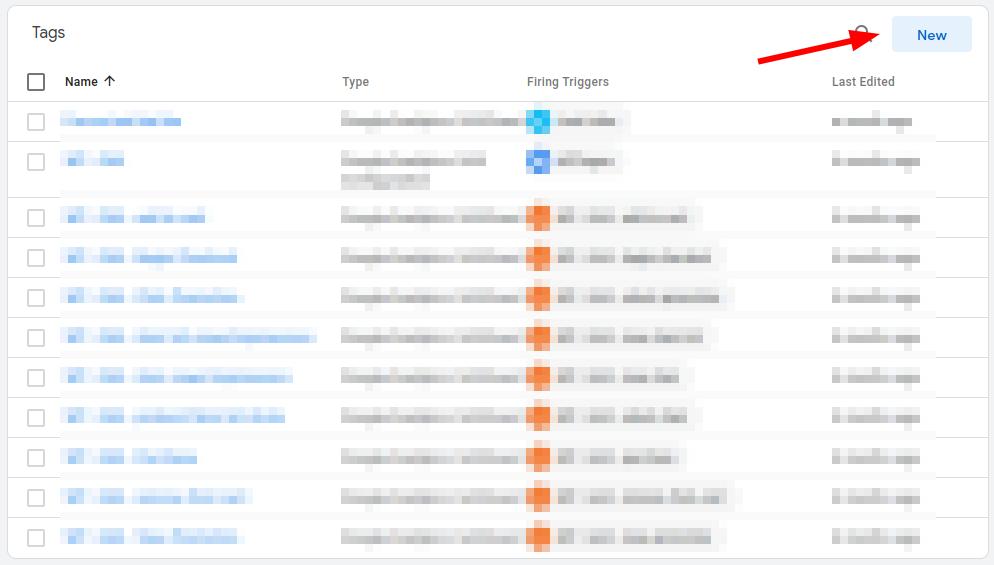
Go to the Tags section and click on a new tag. When the window pop up, you have two sections. One is related to the tag itself, and the other is triggering configuration which will tell the Google Tag Manager when and where to fire that tag.
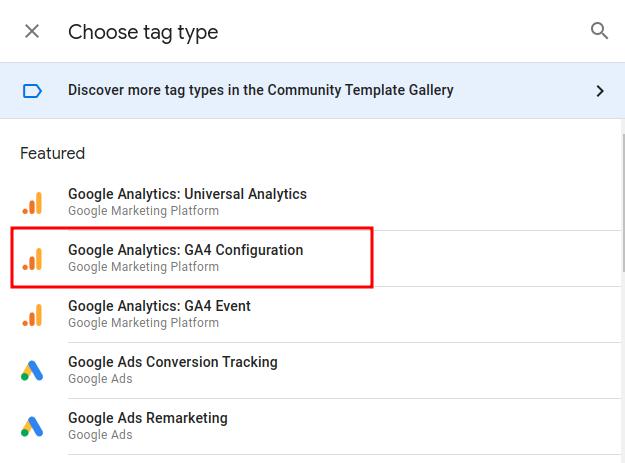
Click on the Tag configuration box. On the right side, the window will pop up. As you can see, the Google Tag Manager supports multiple 3rd party integrations. However, the featured ones are Google’s products.

In this case, you’ll need to click Google Analytics: GA4 Configuration tag which is the first and primary step in configuring GA4. The tag below is for custom events, but let’s keep this for later as we first need to start collecting the pageview data.
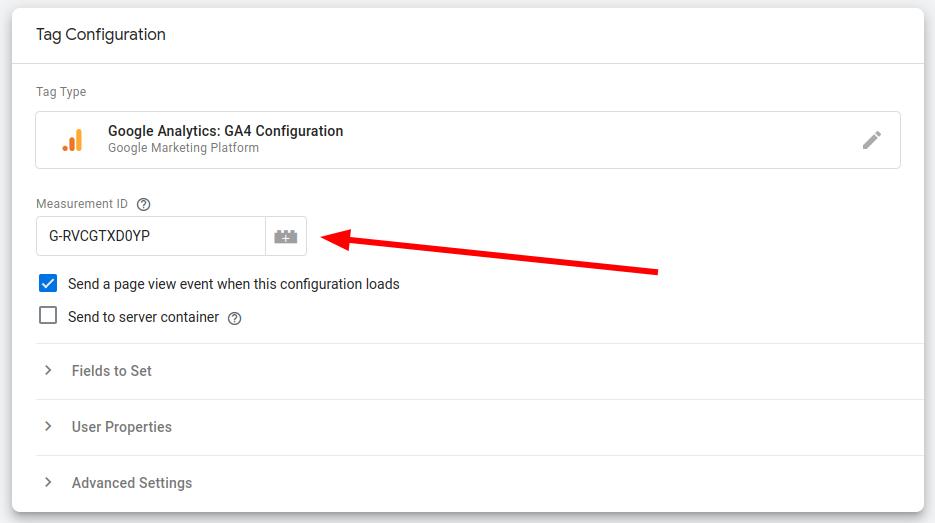
Now you can see the Measurement ID box as well as advanced settings. Enter the Measurement ID from the Google Analytics data stream you made in the first step and leave the rest of the configuration on default (Admin > Property > Data Streams > Your stream name > Measurement ID).
Next, click on the triggering box. The window on the right side will pop up again but with different options. Select the All pages trigger. This will tell the main tag to fire whenever the page on a website is opened.


When selected, click on the Save button in the top right corner.
In the end, enter the tag name. You can call it GA4 Configuration or whatever you like.
But, that’s not the last step. To get Google Tag Manager working you must publish those changes to take effect. Click on the blue Submit button and enter the data regarding comments and version name.

Although both of these fields are optional and you can skip them, it’s desirable to fill boxes that will describe what changes you have made in case you need to revert to the previous version or if you notice strange behavior that will require you to take appropriate actions.
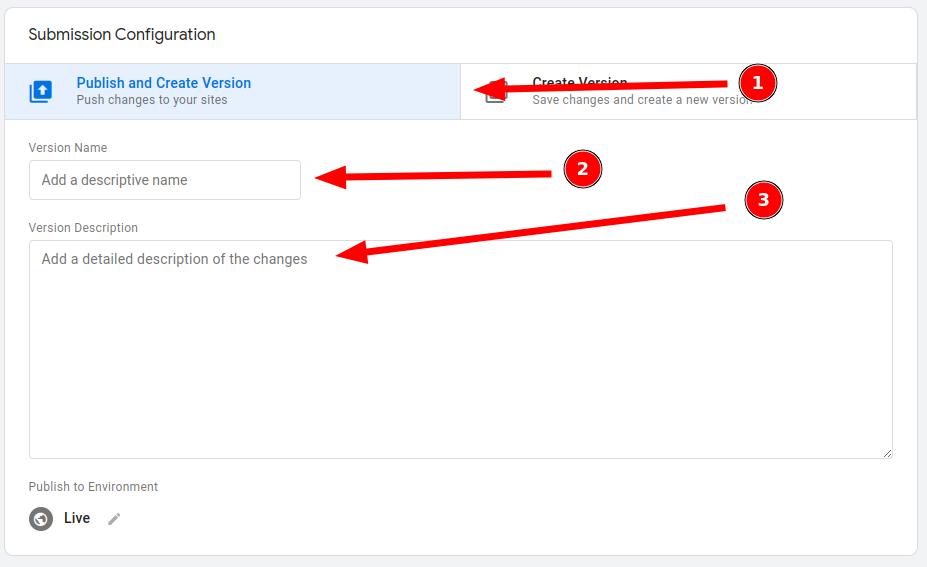
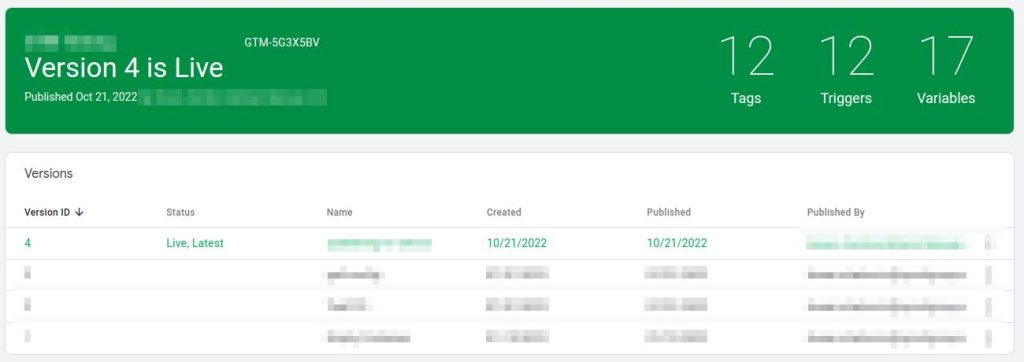
When you hit the Publish button, Google Tag Manager will take a few seconds to publish your changes. After that on the right side, a new window will appear showing you what changes have you made. Close that window and you will see the currently active version and a list of all previous versions.
After you’ve done these steps, the Google Analytics property should start collecting the data but please note that sometimes Google takes from 24 to 48 hours to start with data collection so in this period your dashboard could be empty.
In most cases, the real-time data will start showing hits within minutes but if you occasionally perform changes in your Google Tag Manager container, the more and more time will it take before changes occur, but no more than 48 hours.
Good job, by following the steps above, you successfully implemented Google Analytics 4 tracking on your website.
Google Analytics 4 Dashboard Explained
Yes, lots of things are changed in the new Analytics, but, above all, it’s not rocket science to understand all available metrics in the dashboard.
Let’s, for the beginning, take a closer look. On the left side is the main menu, consisting of 5 categories:
- Home,
- Reports,
- Explore,
- Advertising,
- Configure.
With this in mind, we can conclude that most of the old features are cut out and replaced.
It is what it is, let’s dive into the new dashboard and see what actually awaits us. The sooner we get comfortable with the new version the better.
Home
Part one of the new dashboard and a quick show-off of how your website is currently performing in terms of users and behavior.
At the first glance, you can see a brief overview of basic information about the number of users, engagement time, and total revenue (in case eCommerce tracking is enabled).
On the right side is the real-time data report, kept from the old version, but still a little bit different when you click on the “View realtime” button in the bottom right of that card.

The part below is a showcase of Google AI implementation in an attempt to provide a better and more personalized user experience. It consists of one carousel that acts like a history tab of Analytics showing the dashboards you visited last.
Below that is part with deeper insights and recommendations, Google AI showcase. There are personalized recommendations depending on your website performance and user behavior.
Reports
Standard Google Analytics 4 reports are now divided into three categories, representing the funnel your users go through inside the life cycle. That’s what the first section of the Reports is now called.
The reports in the new version are divided into three categories:
- Life cycle data,
- User data,
- Real-time data.
The novelty in Google Analytics 4 is the ability to connect mobile apps (iOS and Android) and collect data from them, too. However, it will require developers and a Firebase account, which we will not cover this time. Also, mobile app integration requires lots of technical knowledge.
Let’s get back to the report’s exploration mentioned above.
Life Cycle
Life cycle data report gives you insights into users’ behavior inside your funnel. It starts with acquisition and finishes with customer retention. We will examine each of the sections inside the life cycle to get a better understanding of the GA4 basis.
Acquisition
The way in which your website gains visitors is highly important as it helps you scale your marketing efforts. It also assists you in determining the distinction between good-performing and bad-performing mediums. This plays an important role in task prioritization and deciding whether a specific medium needs more work or should be abandoned.
As for the dashboard itself, it shows charts about total users and new users, then mediums that brought visitors. In the left menu, you can see User acquisition and Traffic acquisition where you have an option of exploring mediums and users with more details. Tables and charts are editable.
Engagement
How users behave on your website and engage with it is now measured in a different way in Google Analytics 4. As everything now is event-based, these reports give you an insight into what visitors are doing on your website.
For example, under the Events tab, you have detailed information about events like page views, downloads, scrolls, etc. Data includes custom events, too, if you have configured them, as well as eCommerce events.
These events are useful when it comes to analyzing how users are going through your sales funnel, for example.
Compared to Universal Analytics, we now don’t have goals anymore. They are replaced by conversions.
How to track conversions then?
Google has made this process quite simpler to set up. However, you will need adequate events if you want to track some specific data.
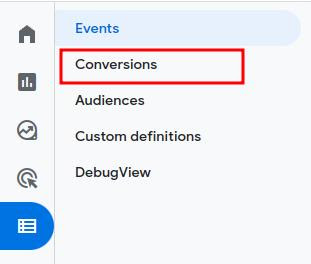
At the very beginning, when you set up Google Analytics, most of the predefined events will be marked as conversions, even the page_view event. To turn it off, you will need to configure it. Head to Configure > Conversions and mark the events you want to track.
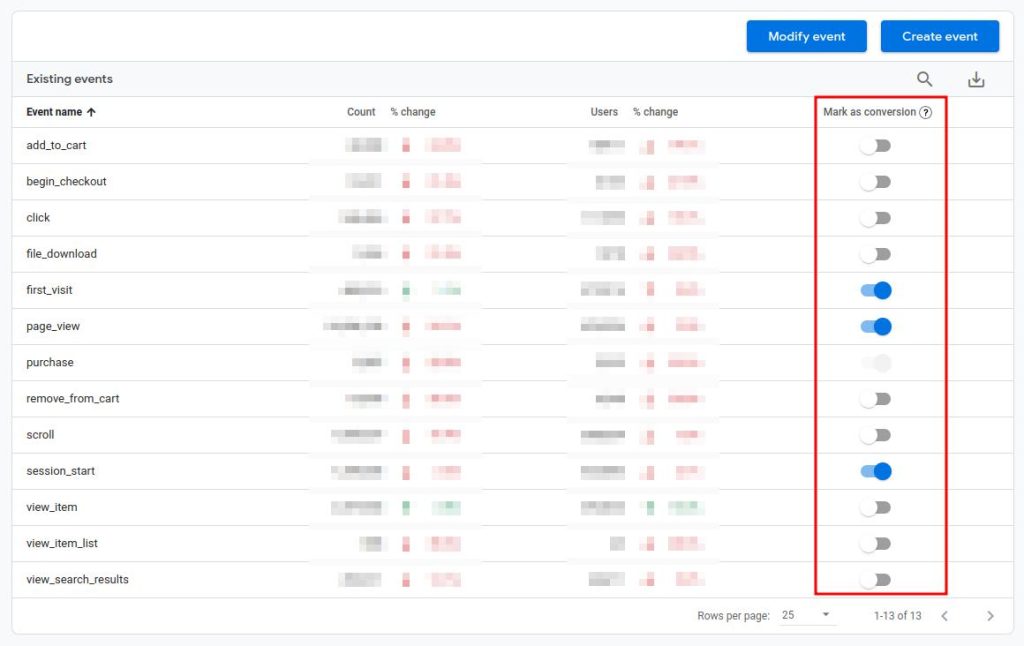
There’s one exception to this. The purchase event is always marked as a conversion event, there is no way to turn it off whatever you do. However, this should be expected, as the final goal of every business is to make a sale.
Monetization
Unless you have eCommerce data collection configured, you can skip this section as it won’t be usable for you.
Hence, if you implemented eCommerce tracking, here you can find how much your business has earned through your website.
Monetization overview gives you insight into the total revenue that your website has generated, average revenue per user, average revenue per paying user, etc.
These metrics will help you in altering your marketing strategy in the future, so if you own an eCommerce website, make sure to integrate monetization events. If you find this particularly complex, depending on the platform you are using, you can make this process simple by installing extensions, plugins, etc.
Retention
The retention dashboard is referring to the users that come back to the website. This means that users who visit the website, return within a 42-day timespan, and engage with the website are considered returning users, and they are counted in these statistics.
User
This category is divided into two segments: Demographics and Tech. In these reports, you have an overview of the location where your users are coming from as well as the technical details involved in those sessions.
Demographics
Depending on your business goals, you may find these reports really important. Also, if you already have a buyer persona, these reports will help you discover are your marketing actions are bringing the right people to your website.
If not, you should review your marketing strategy and update it.
Keep in mind that small discrepancies in data are completely normal, so if your collected data departs are huge, you should act upon your strategy.
The pieces of data included in these reports are:
- Country – The number of visitors per country they came from;
- City – Geographical data from countries narrowed down to cities;
- Gender – How many visits have you gotten from each gender;
- Age – The visitors separated into different age groups;
- Language – The number of visitors according to the language they use;
- Interests – Interests of your visitors.
Note on the Interest reports: this report is not 100% accurate and should not be used for your buyer persona. For example, you may have a fashion website with a decent number of visits that generate solid revenue. You would expect to see fashion as the dominant interest, but that may not be the case, so don’t take this data too much into account.
Tech
What platforms do your visitors use to get to your website? What are their devices and even their devices’ resolutions? This information is available under the Tech tab.
As over 60% of visitors come through smartphones and tablets, you’ll find this data really useful in further website optimization. Take into consideration that Google uses mobile-first indexing and act accordingly.
Realtime
Tracking real-time data show you what is currently happening on your website, which pages your users visit, where they are coming from, and how they engage with your website (events).
To access this dashboard, head to the left menu, and you’ll find it just below the Reports snapshot.
The Analytics shows the data for the last 30 minutes.
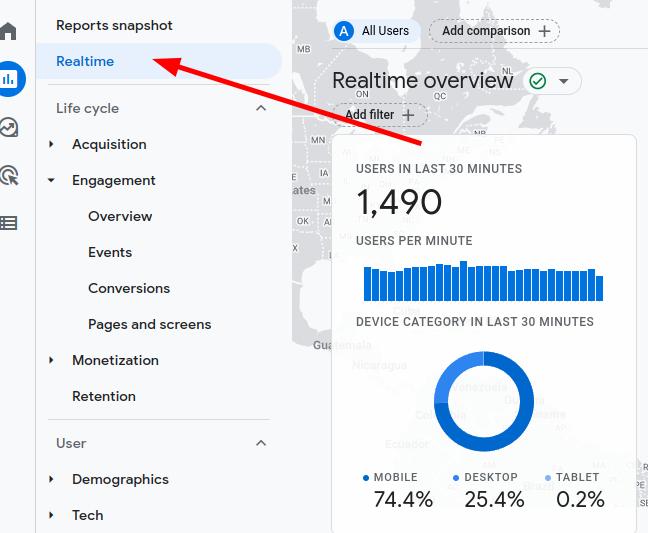
The first thing you will notice is a bunch of different data, including the geo map and a bunch of blue dots.
The map gives you info about locations where your users are coming from, precisely, the city. A bigger blue dot means more users are visiting from a specific city, so don’t be confused with differences in the blue dot sizes.
Below are reports showing the sources from which users came to the website, the audience they belong to, the pages they viewed, and triggered events.

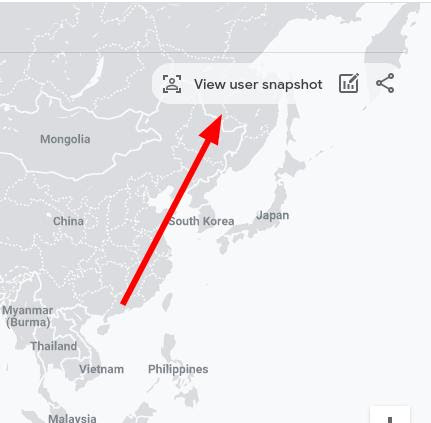
GA4 also allows you to explore each user individually within those 30 minutes. You can access this data by clicking on the View user snapshot button in the top right corner.
The next thing you can see is the data including Location, Device name, and two timelines representing their behavior on the website within their session.
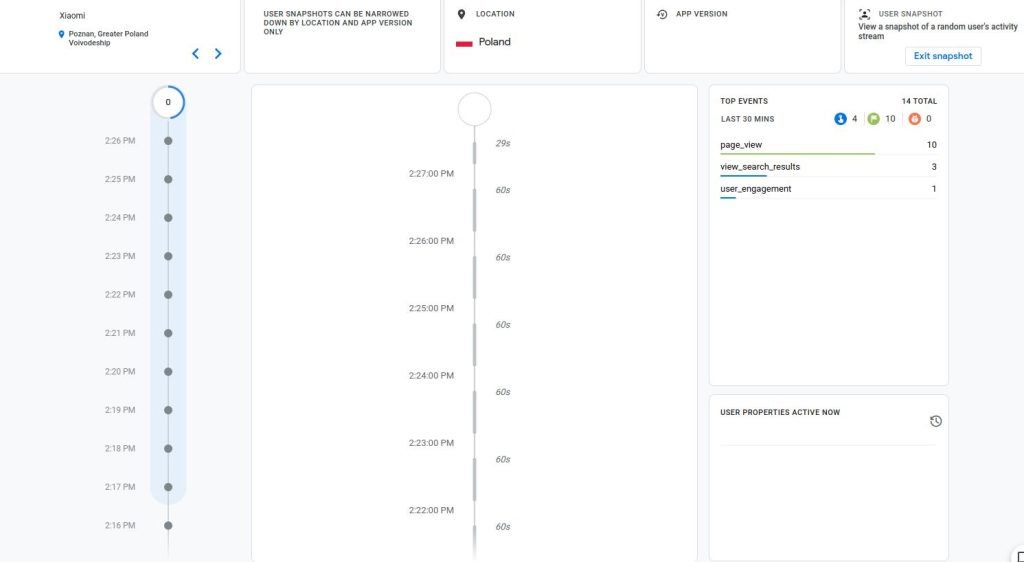
To navigate through users, click on the small arrows in the box with the device name and location information.

Explore
This is the most powerful feature inside the new Analytics dashboard. Here, you can create custom reports or choose one from the premade templates. The premade templates include:
- Funnel exploration,
- Path exploration,
- Segment overlap,
- User explorer,
- Cohort exploration,
- User lifetime.
But, that’s not all. You can create a blank form and manipulate reports to show data with metrics and dimensions however you want. Just keep in mind that every time you open a custom-made report you already used, you must change the date range to get the recent data.
Advertising
Knowing how your paid campaigns perform is crucial for your business. By this, you should always have an insight into their performance, and that’s where the Advertising workspace comes in handy.
On the left side, you can see the segmentation of reports, divided into Advertising snapshot, Performance, and Attribution.
The advertising snapshot briefly shows you which channels brought the most conversions and conversion paths, while the performance tab gives you a bit more information regarding the channels and conversions.
Now, let’s talk about the Attribution dashboard.
The reports are based on marketing attribution models where you can track through which channels users engaged before making a conversion on your website.
At the conversion paths dashboard, you can find one Ads-prefered report (Last click), and 6 different cross-channel reports. They include:
- Data-driven model,
- Last click model,
- First click model,
- Linear model,
- Position-based model,
- Time decay model.
Now, what does this mean? To put it simply, these reports show a path to the conversion on the website, while each of these reports represents different data.
For example, if you pick the last click attribution model, you will see data about channels used just before making a purchase (conversion). Most reports in Google Analytics 4 use this model to present data.
On the other hand, if you wish to compare models mutually, you can do this by clicking on the Model comparison tab.
Configure
Setting up conversions and creating new events, dimensions, or even metrics is available through the Configure tab. On the very first click on this tab, you will be redirected to the dashboard with all events that are active on your website.
Here you can configure which events will be marked as conversions and which ones will not (this is also possible through the second tab called Conversions, under the Configure tab).
Besides setting conversions, here you can create new custom events which are unnecessary as we will use Google Tag Manager for this kind of work.
But, the thing you will find very useful is custom dimensions and metrics which you can create through the Custom definitions dashboard. However, this one requires more technical knowledge and maybe the involvement of a developer.
Frequently Asked Questions
Should I replace Universal Analytics with Google Analytics 4? If you have Universal Analytics already installed, you don’t have to replace it still since the data you have is still valuable. However, Universal Analytics will go off by July 1, 2023, and it is recommended to install Google Analytics 4 to start collecting data ASAP. You can use both of them simultaneously on your website. Don’t be afraid – the one won’t affect the other.
What is the key difference between Universal Analytics and Google Analytics 4? Except for the dashboard itself, the concept is changed as everything in Google Analytics 4 is now based on different events. Also, data is distributed differently showing the user behavior and engagement through the marketing funnel.
Is Google Analytics 4 better than Universal Analytics? We can’t really tell at the moment which one is better. Both of them are great and offer valuable data, and both have their own pros and cons. However, Universal Analytics will soon be gone, so you should switch and adapt to the new dashboard to better utilize the available data for future marketing plans.
How long does it take for Google Analytics 4 to start collecting data? The same rule applies to Universal Analytics. It takes between 24 and 48 hours maximum to see the data inside Google Analytics 4. The real-time data should start showing data as soon as you publish your Tag Manager container. However, if you occasionally make changes to the Tag Manager container, real-time data may take time to start collecting data immediately.
My Analytics data is not the same as the data in my website dashboard, why? While Analytics is currently the most popular platform for data analysis, there will always be some small discrepancies. The reasons may be numerous such as cookie consent, disabled JavaScript in the user browser, closing the window before the Tag Manager fires, etc. However, if discrepancies are too big, you should recheck your configuration step by step to see if you have configured everything correctly.
Google Analytics 4 Tutorial for Beginners: Conclusion
Well, we just explained in short how to install Google Tag Manager and Google Analytics 4 on your website.
However, Google Analytics has much more to offer, despite suffering the major overhaul with many cut-off features compared to the previous version.
To sum up, when paired, GTM and GA4 provide various tools and capabilities to help you with data collecting and optimizing your marketing activities.
Although at first GA4 was poor in terms of data, when you get used to it, you will see it’s a powerful tool with even better data segmentation.
